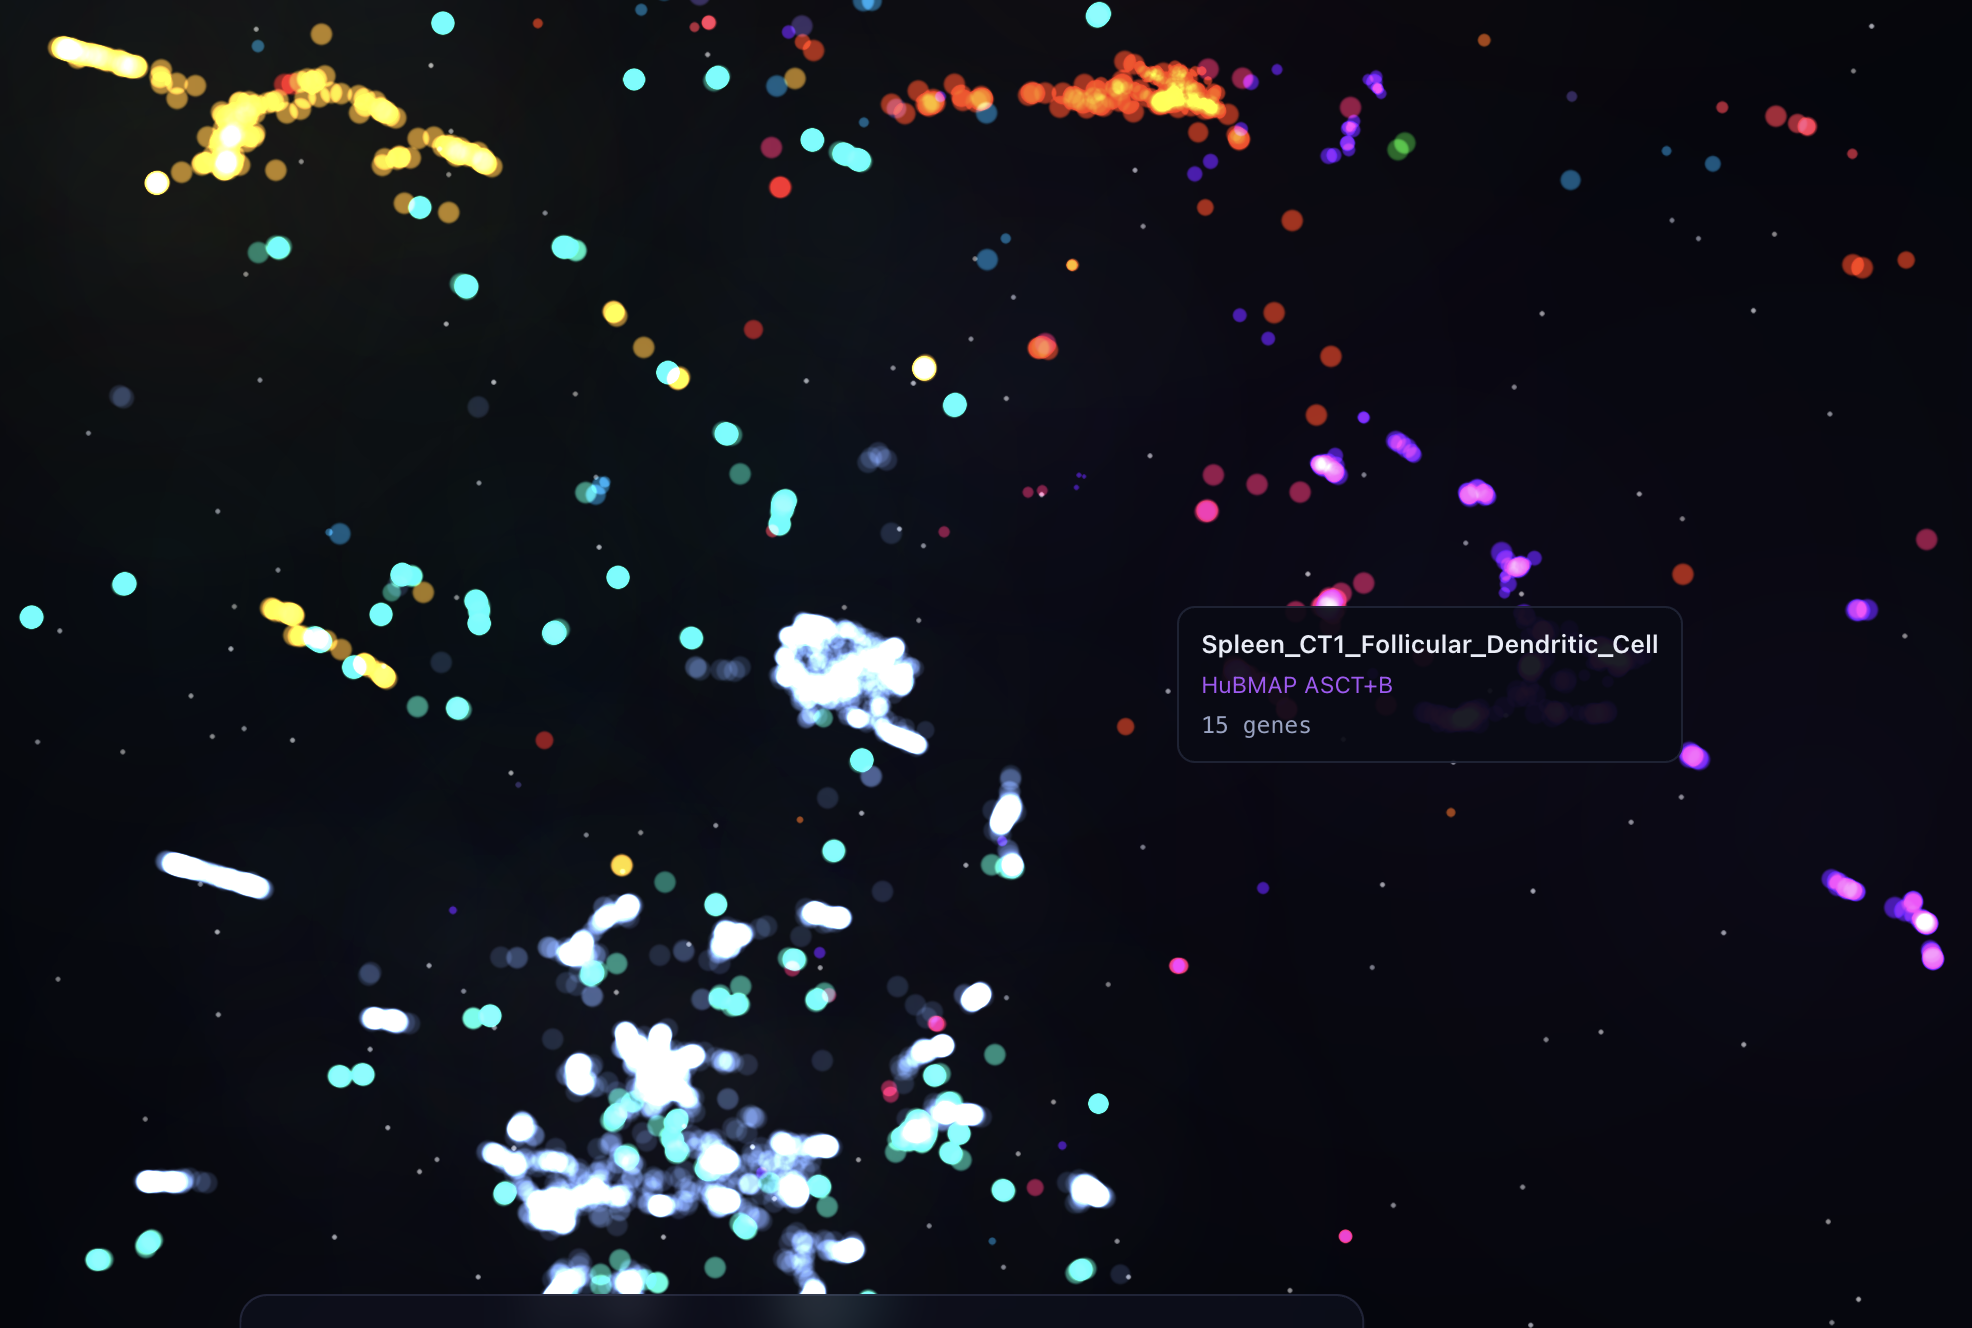
Data Visualization Competition - April 15 – June 30, 2026
The CFDE Training Center challenged users to create a visualization that tells a compelling biomedical story, sparks community connection, and highlights the breadth of Common Fund resources.
The results are in, and they are exceptional!
Additional Information
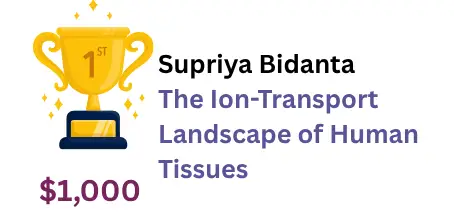
Find out more about this visualization by clicking the graphic below:
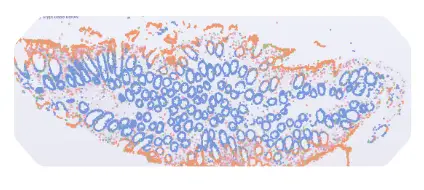
Find out more about this visualization by clicking the graphic below:
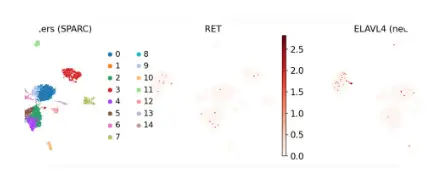
Find out more about this visualization by clicking the graphic below:
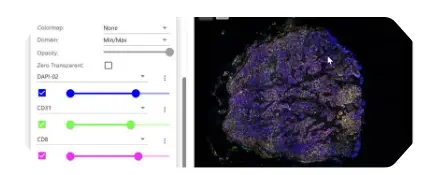
Abhinav Asthana
Diet and Alzheimers
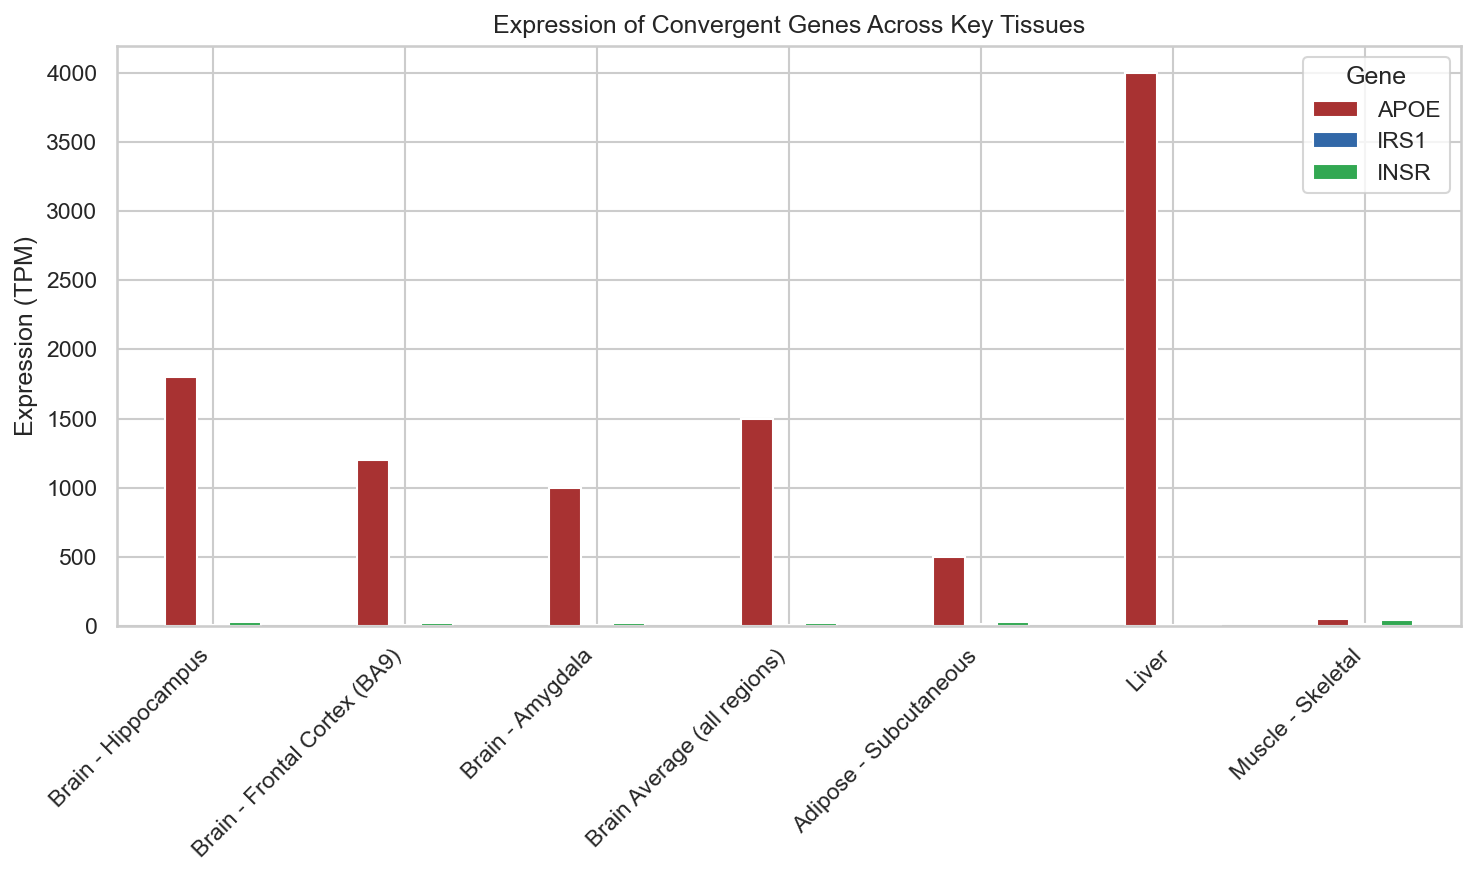
Munira Haque
Selective Loss of Antioxidant Defenses in AD
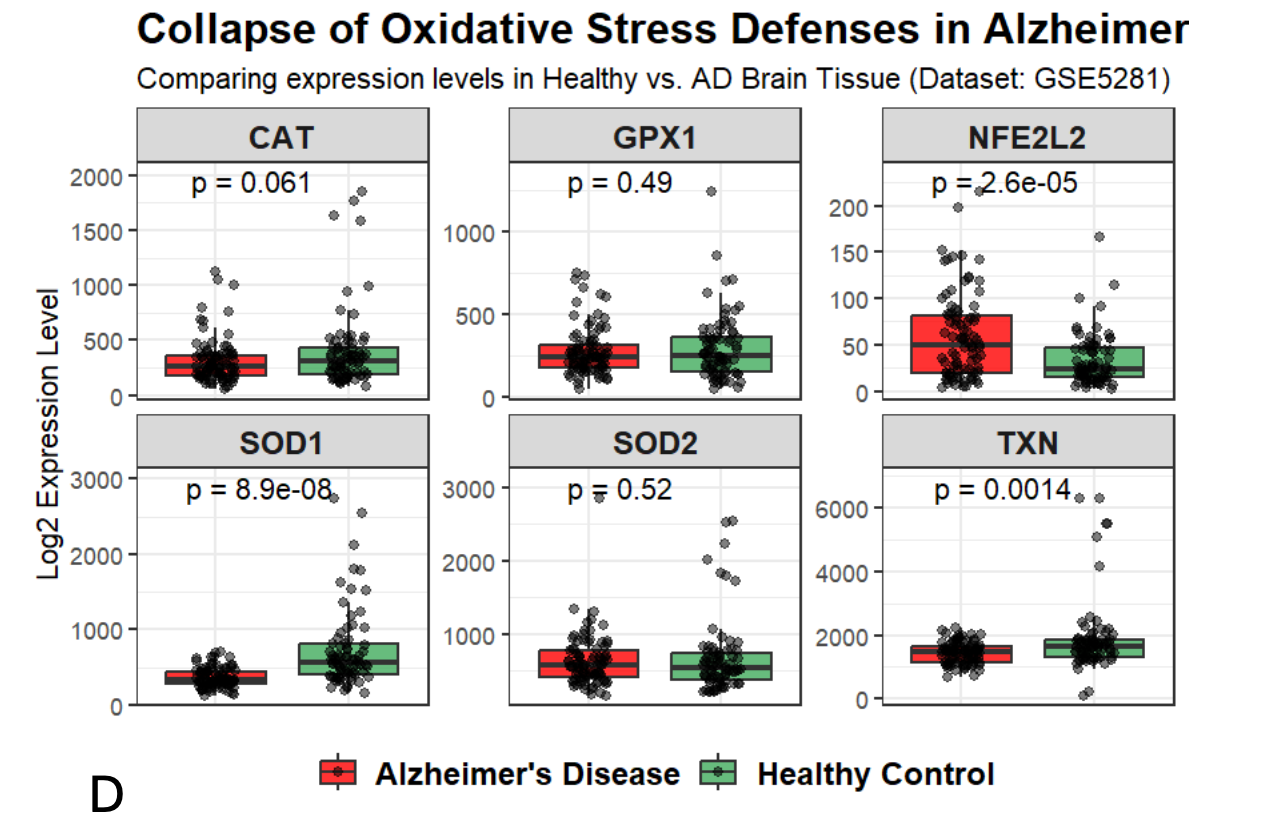
S.M.A.S.A. Sewwandi
The Immune Landscape of Tumors: A Multi-Omics Atla
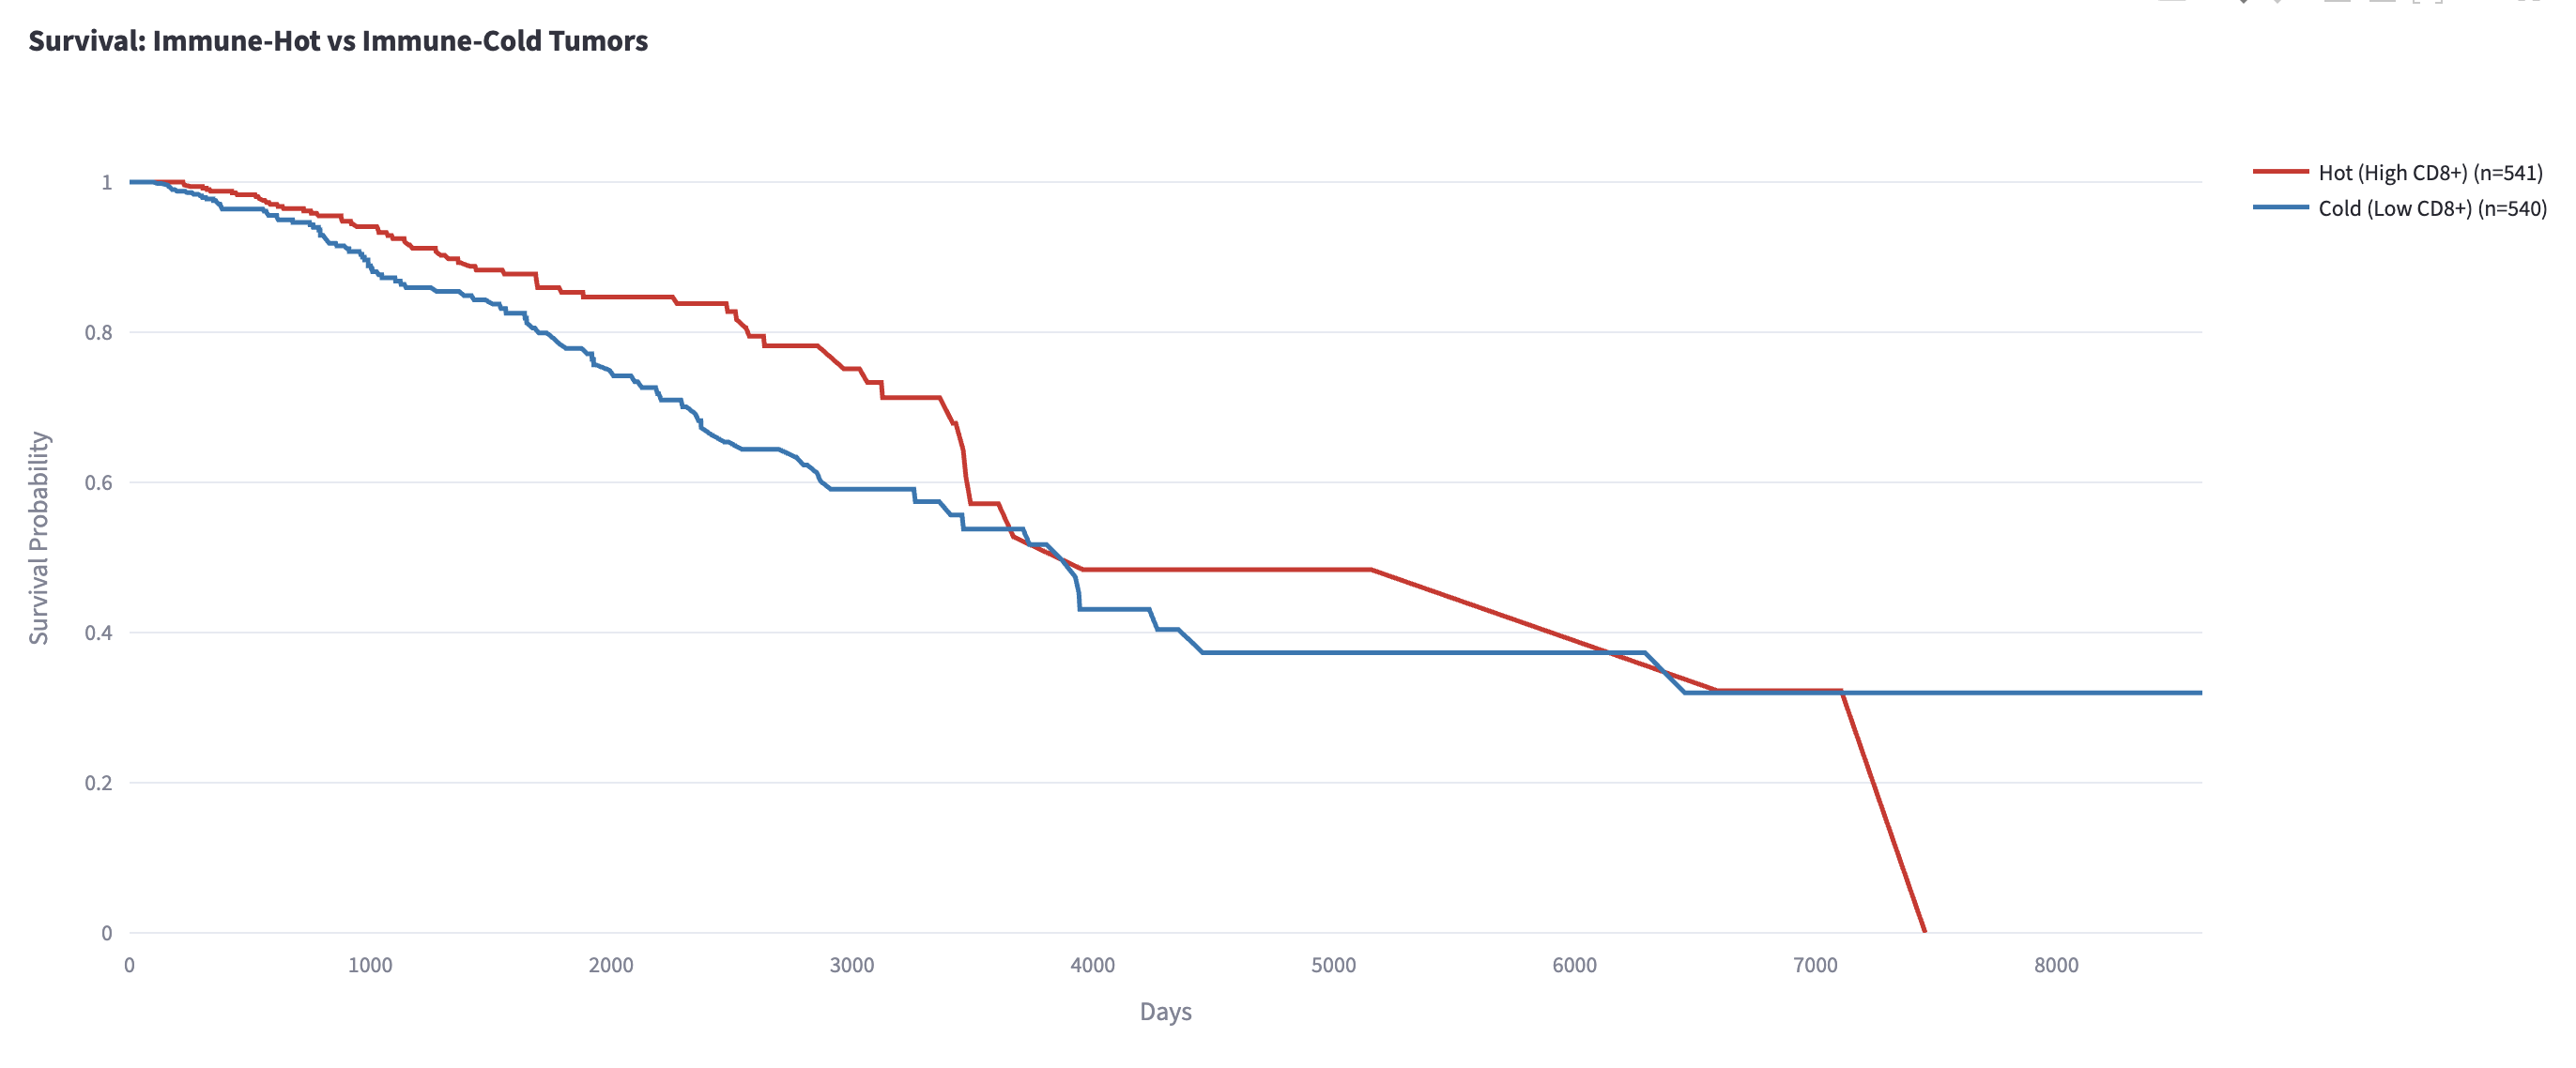
S. Upama Roy Chowdhury
Decoding Neurodegeneration
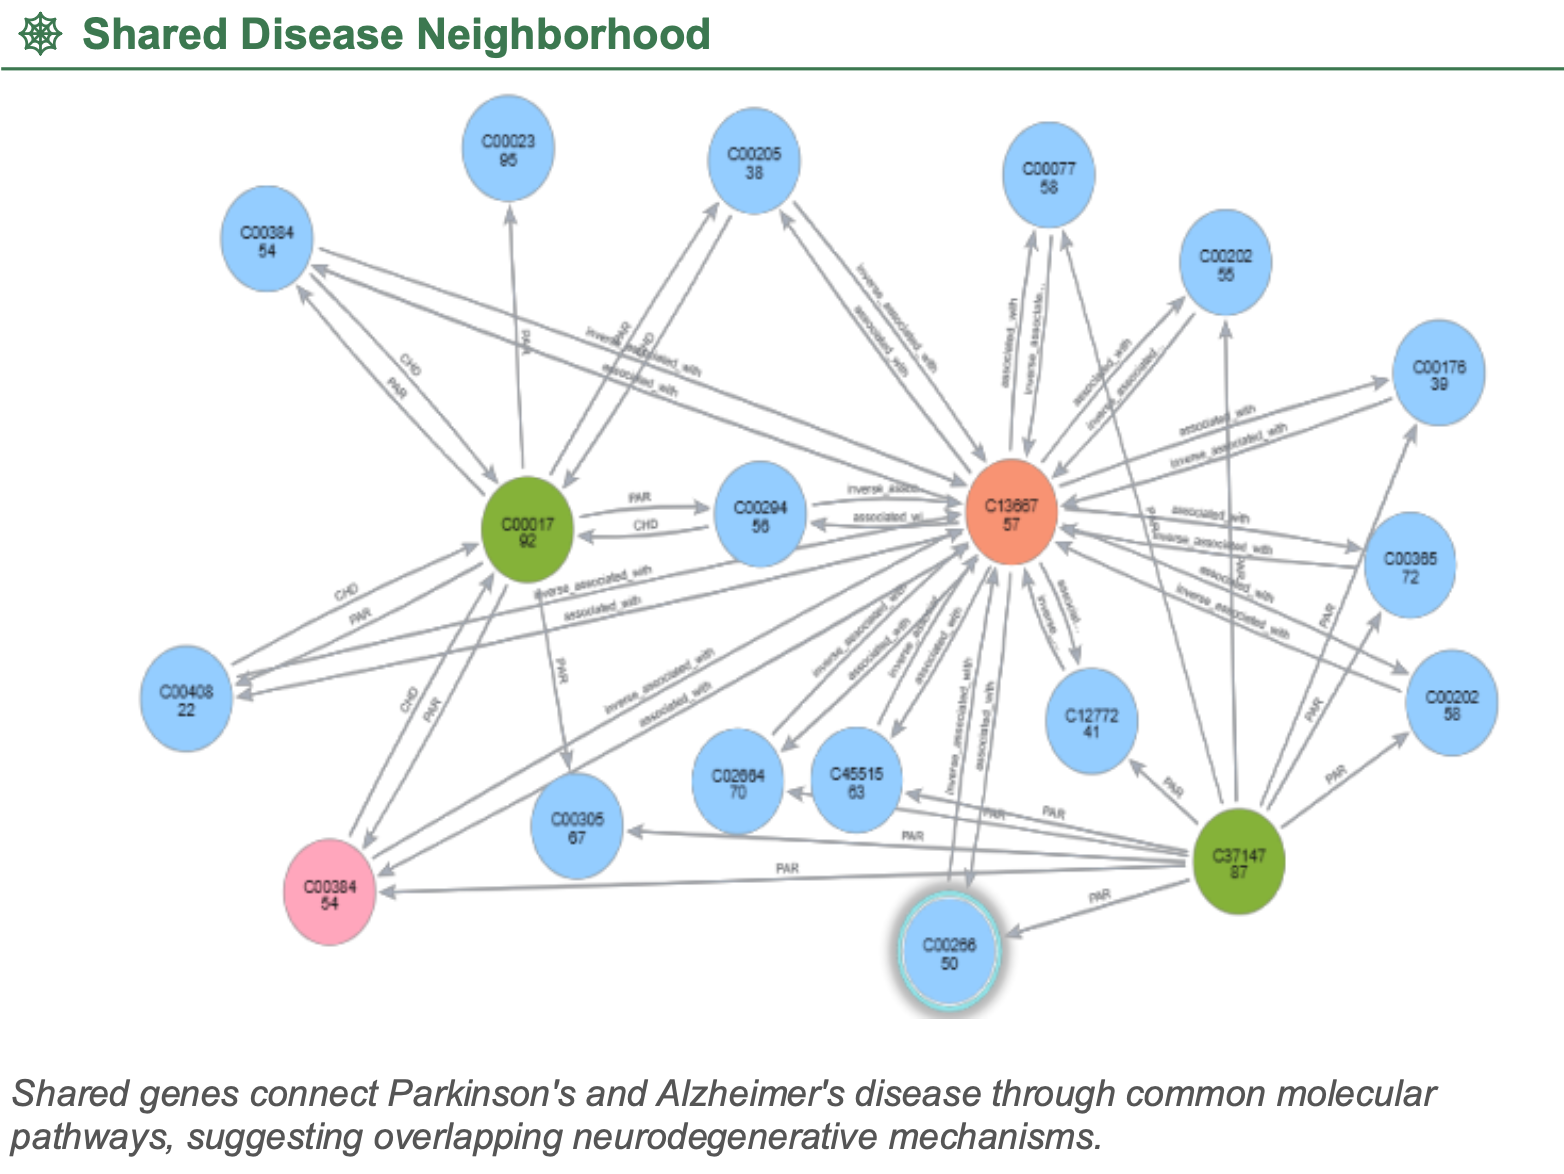
Dalia Khaizaran
Multimodal Patterns Across Diabetes Severity in AI
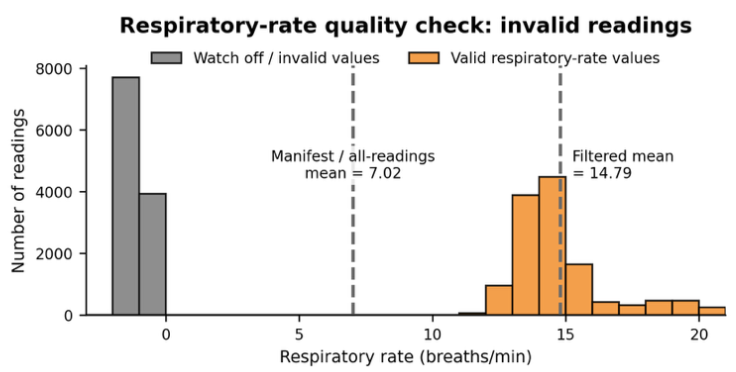
Shrramana Ganesh Sudhakar
Bridge2AI-Voice Multimodal Data Dashboard
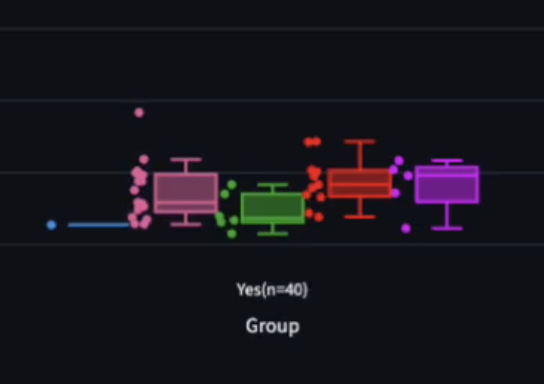
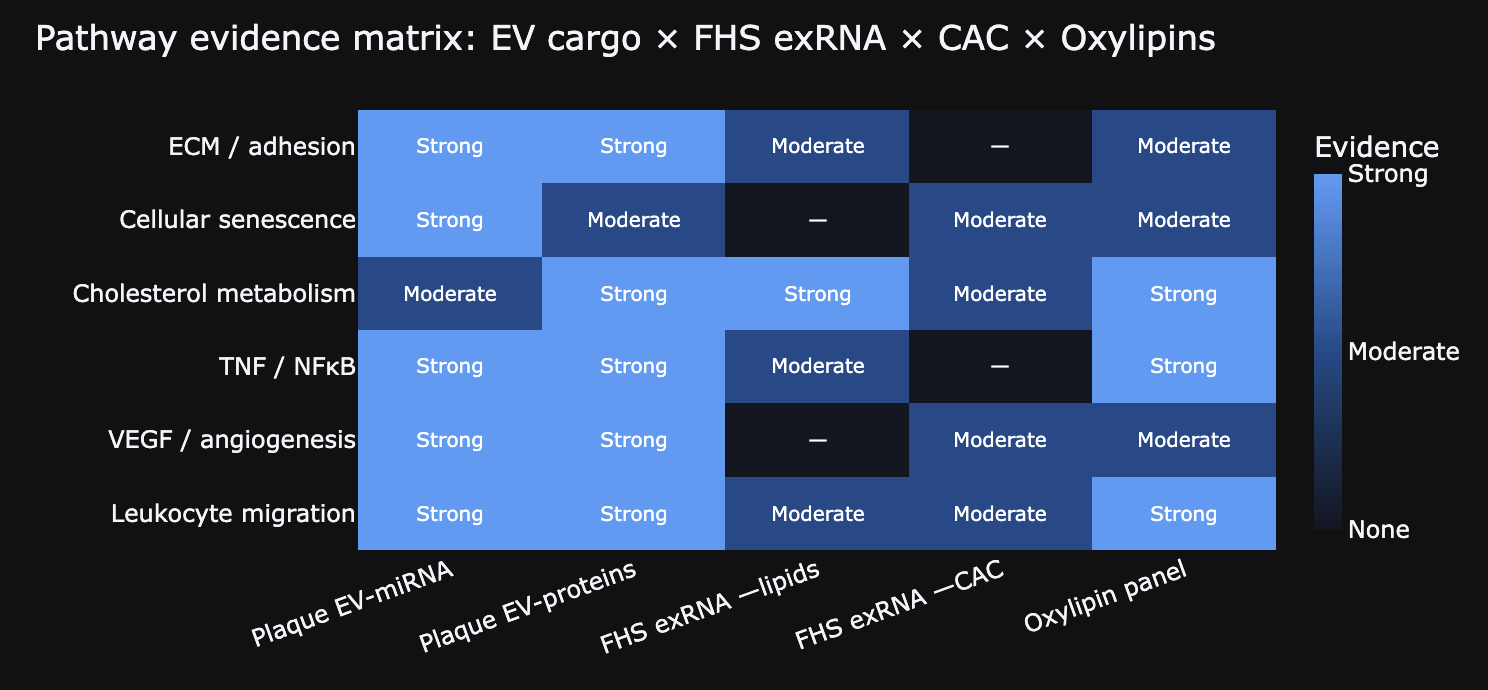
Ujjalkumar Subhash Das
EVs as molecular couriers of atherosclerosis
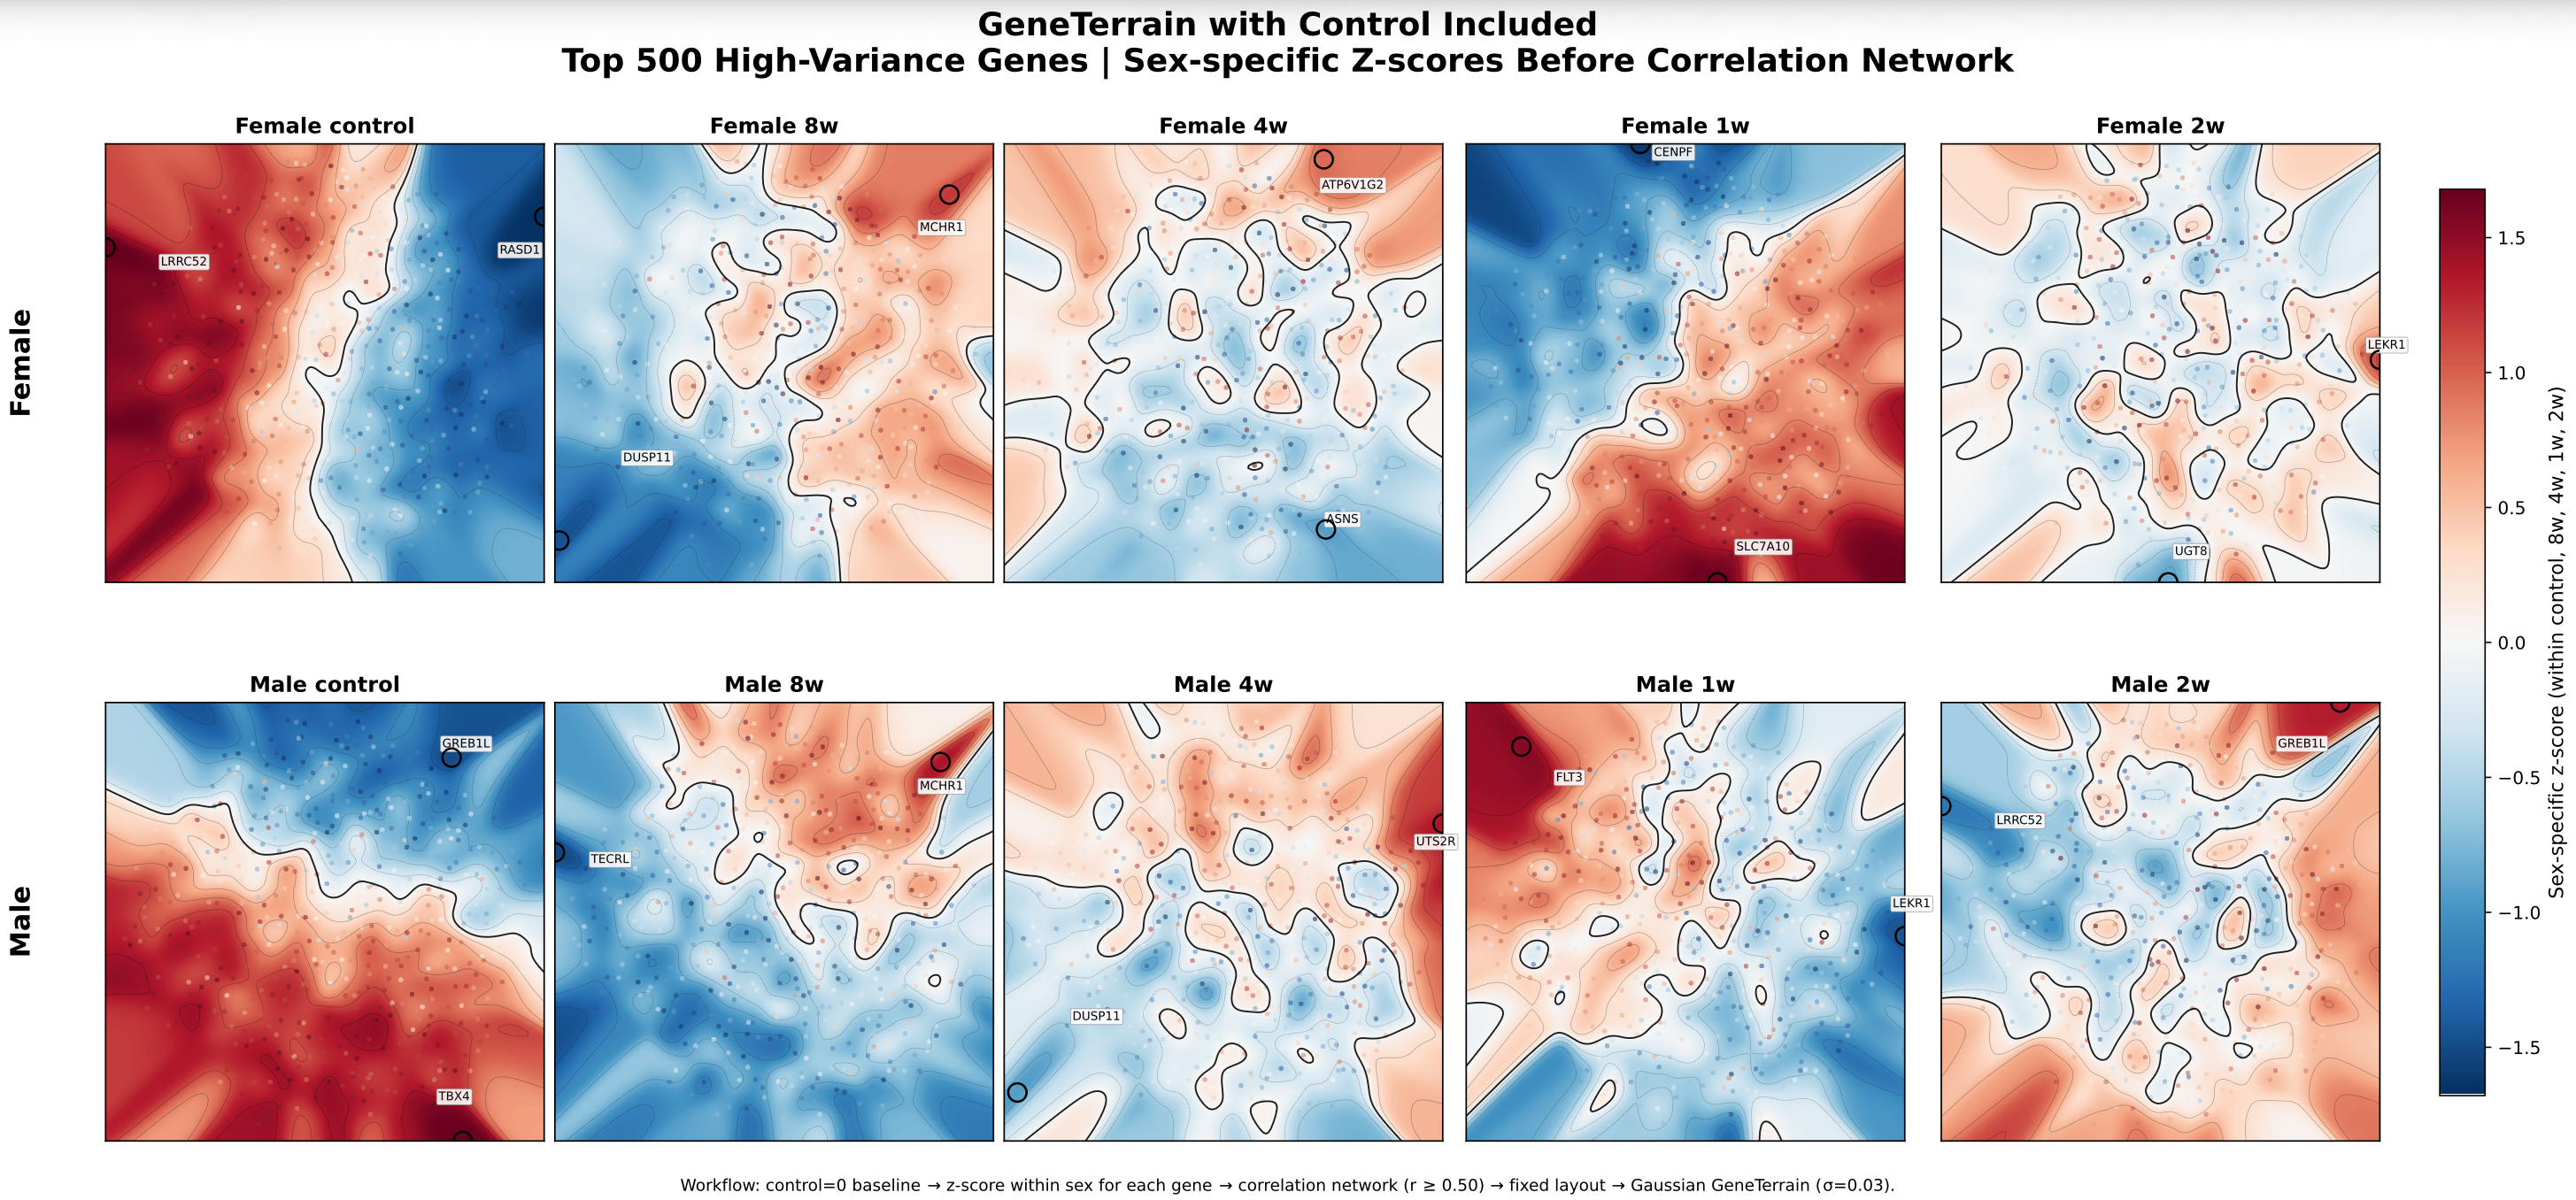
Ehsan Saghapour
GeneTerrain of Muscle Adaptation
Chase Yakaboski
The CFDE Knowledge Constellation